Operative Kennzahlen
| On 12/31/2024 (9 months) | On 09/30/2024 (H1) | On 06/30/2024 (Q1) | On 03/31/2024 (FY) | |
|---|---|---|---|---|
|
Utilization rate |
73% |
73% |
73% |
73% |
|
Average daily rate |
€937 |
€937 |
€944 |
€898 |
|
Order book |
4.5 months |
3.7 months |
4.3 months |
4.1 months |
|
Headcounts |
5,990 |
5,875 |
5,868 |
5,894 |
Vereinfachte Gewinn- und Verlustrechnung
| (€m) | H1 2024/25 | H1 2023/24 | CHANGE |
|---|---|---|---|
|
Revenue |
457.8 |
276.7 |
+65% |
|
Recurring operating profit(1) |
46.4 |
36.8 |
+26% |
|
Recurring operating margin |
10.1% |
13.3% |
|
|
Operating profit |
41.6 |
33.2 |
+25% |
|
Net income |
27.3 |
23.0 |
+19% |
|
Net margin |
6.0% |
8.3% |
|
|
Group share of net income |
27.2 |
23.0 |
+19% |
|
Earnings Per Share (in €) |
1.11 |
1.16 |
-4% |
(1) Recurring Operating Profit (ROP) is an alternative performance indicator related to current activities. This indicator corresponds to the „Operating income“ adjusted for the following amortization of customer relationships and other operating income and expenses. It should be noted that the ROP is identical to the aggregate previously named EBIT (“résultat opérationnel courant”) in Wavestone’s financial communication.
(2) The 2023/24 pro forma accounts have been calculated as if the acquisitions of Q_PERIOR and Aspirant Consulting had taken place on April 1, 2023.
Verkürzte Kapitalflussrechnung
| (€m) | H1 2024/25 | H1 2023/24 |
|---|---|---|
|
Self-financing capacity before costs of net financial debt and tax |
54.3 |
39.4 |
|
Net operating cash flow |
2.5 |
9.3 |
|
Net investing cash flow |
(37.8) |
(6.5) |
|
Net financing cash flow |
8.6 |
(19.7) |
|
Net change in cash and cash equivalents |
(26.7) |
(16.9) |
Aufstellung des Aktienkapitals

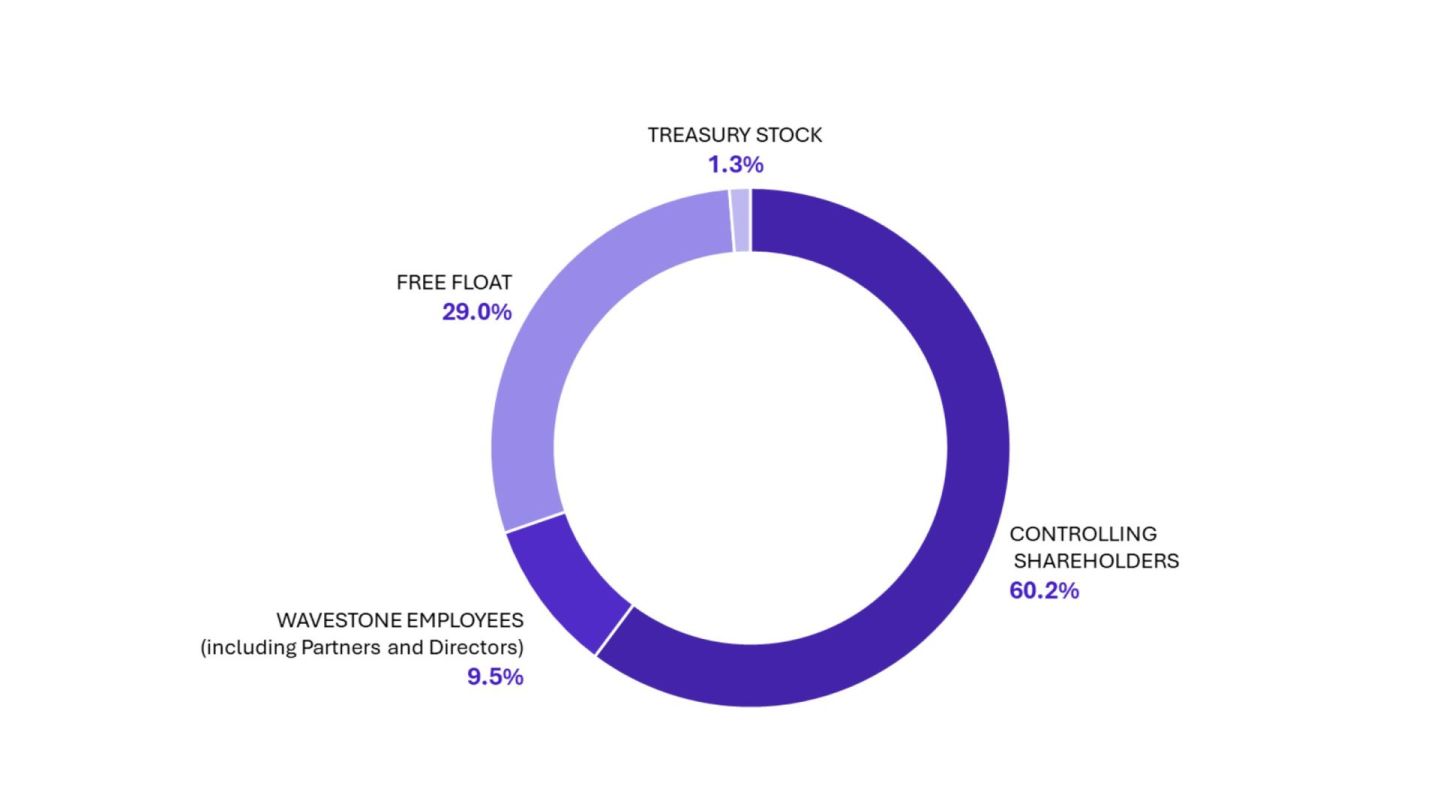
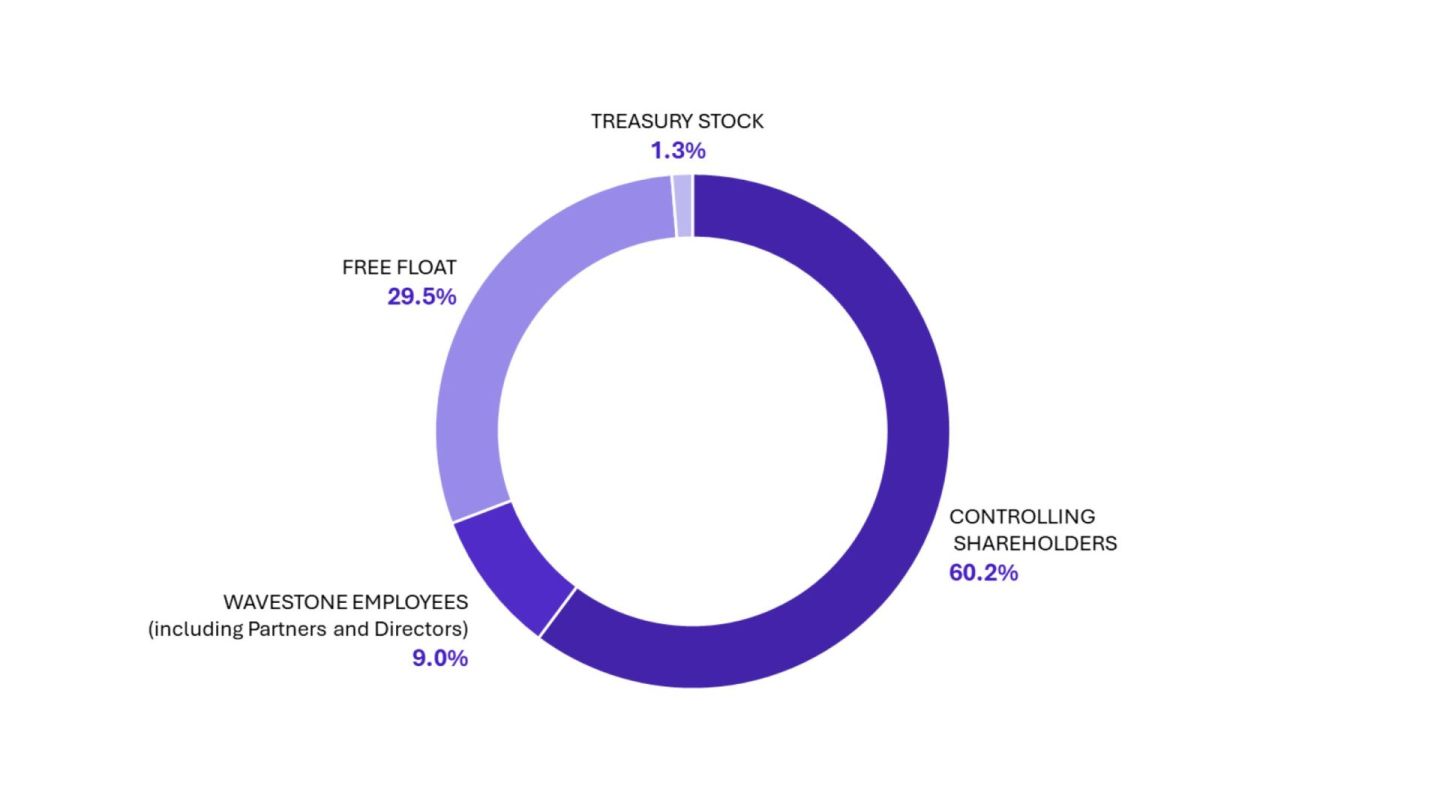
Die Grafik zeigt die Aufteilung des Aktienkapitals von Wavestone am 30. September 2024.
Die Aufteilung der Aktionäre ist wie folgt:
- Mehrheitsaktionäre (Familie Imbert und Familie Dancoisne-Chavelas): 60.2%
- Streubesitz: 29,0%
- Mitarbeiter von Wavestone: 9,5%
- Eigene Aktien: 1,3%
Bilanz

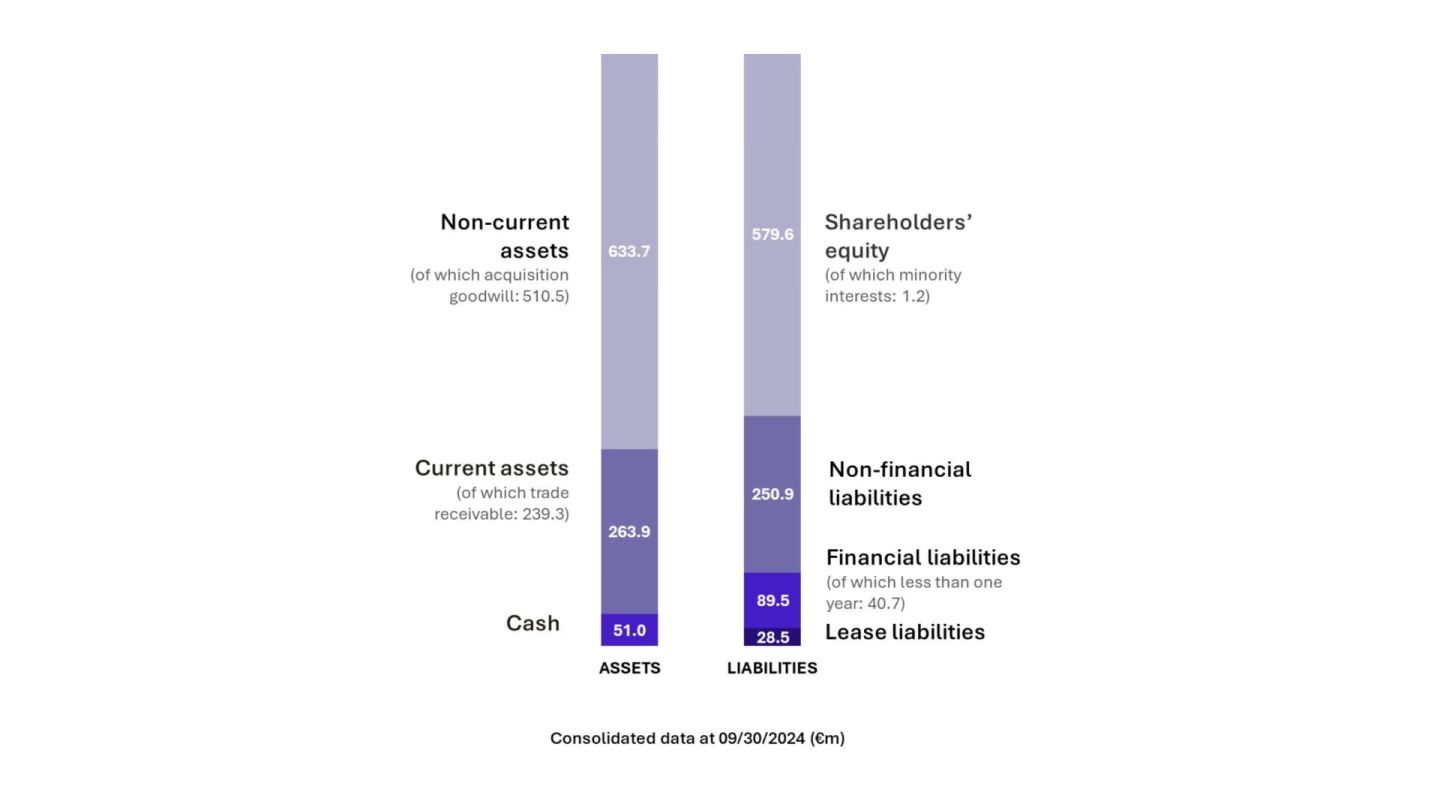
Das Schaubild zeigt die Aufteilung der WaDas Schaubild zeigt die konsolidierte Bilanz von Wavestone zum 30. September 2024, aufgeteilt in zwei Spalten. Die erste Spalte stellt die Aktiva und die zweite die Passiva dar.
Auf der Aktivseite setzt sich die Bilanz wie folgt zusammen:
Langfristige Vermögenswerte:
- 633,7 Mio. €, einschließlich 510,5 Mio. € Goodwill
- Umlaufvermögen: 263,9 Mio. €, davon 239,3 Mio. €
- Forderungen aus Lieferungen und Leistungen
Bargeld: 51,0 M€
Auf der Passivseite sind zu nennen:
- Eigenkapital: 579,6 Mio. €, davon 1,2 Mio. € für Minderheitsanteile
- Nicht-finanzielle Verbindlichkeiten: 250,9 M€
- Finanzielle Verbindlichkeiten: 89,5 Mio. €, davon weniger als ein Jahr: 40.7 M€

