Operational indicators
| On 12/31/2024 (9 months) | On 09/30/2024 (H1) | On 06/30/2024 (Q1) | On 03/31/2024 (FY) | |
|---|---|---|---|---|
|
Utilization rate |
73% |
73% |
73% |
73% |
|
Average daily rate |
€937 |
€937 |
€944 |
€898 |
|
Order book |
4.5 months |
3.7 months |
4.3 months |
4.1 months |
|
Headcounts |
5,990 |
5,875 |
5,868 |
5,894 |
Simplified income statement
| (€m) | H1 2024/25 | H1 2023/24 | CHANGE |
|---|---|---|---|
|
Revenue |
457.8 |
276.7 |
+65% |
|
Recurring operating profit(1) |
46.4 |
36.8 |
+26% |
|
Recurring operating margin |
10.1% |
13.3% |
|
|
Operating profit |
41.6 |
33.2 |
+25% |
|
Net income |
27.3 |
23.0 |
+19% |
|
Net margin |
6.0% |
8.3% |
|
|
Group share of net income |
27.2 |
23.0 |
+19% |
|
Earnings Per Share (in €) |
1.11 |
1.16 |
-4% |
(1) Recurring Operating Profit (ROP) is an alternative performance indicator related to current activities. This indicator corresponds to the “Operating income” adjusted for the following amortization of customer relationships and other operating income and expenses. It should be noted that the ROP is identical to the aggregate previously named EBIT (“résultat opérationnel courant”) in Wavestone’s financial communication.
(2) The 2023/24 pro forma accounts have been calculated as if the acquisitions of Q_PERIOR and Aspirant Consulting had taken place on April 1, 2023.
Summary cash flow statement
| (€m) | H1 2024/25 | H1 2023/24 |
|---|---|---|
|
Self-financing capacity before costs of net financial debt and tax |
54.3 |
39.4 |
|
Net operating cash flow |
2.5 |
9.3 |
|
Net investing cash flow |
(37.8) |
(6.5) |
|
Net financing cash flow |
8.6 |
(19.7) |
|
Net change in cash and cash equivalents |
(26.7) |
(16.9) |
Breakdown of share capital
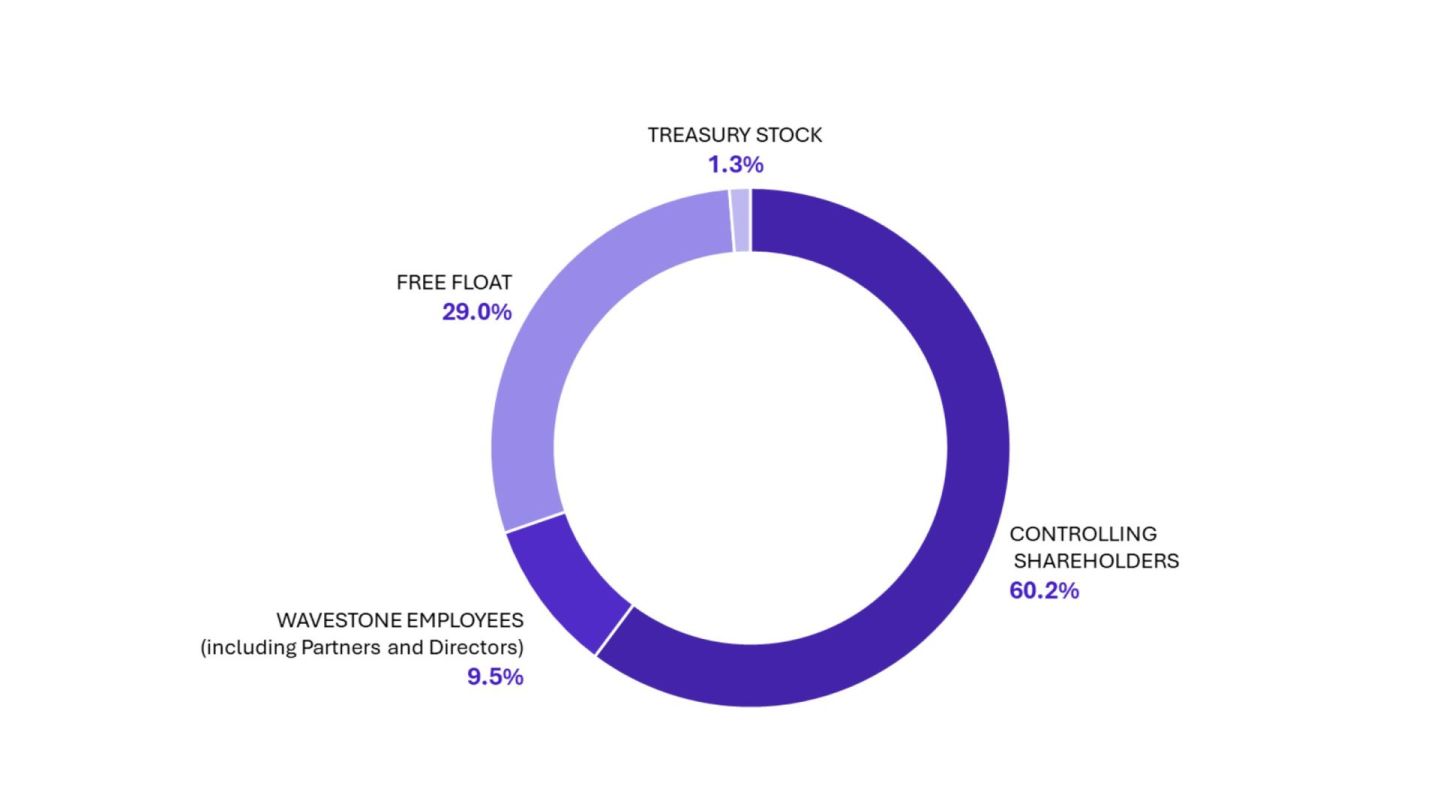
The chart shows the breakdown of Wavestone’s share capital on 30 September 2024.
The breakdown of shareholders is as follows:
- Action in concert (Imbert family and Dancoisne-Chavelas family): 60.2%
- Free float: 29.0%
- Wavestone employees represents 9.5%
- Treasury stock: 1.3%
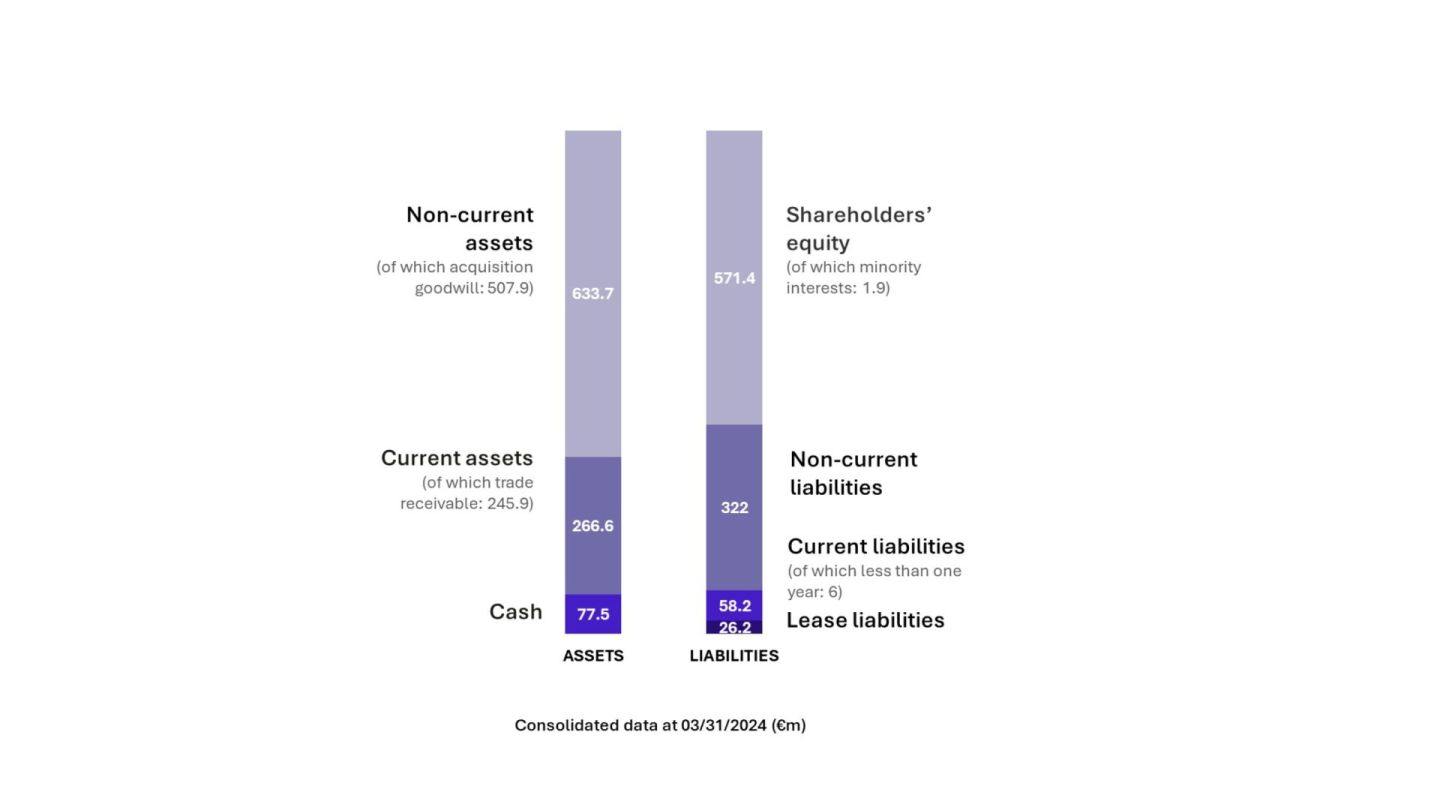
Balance sheet
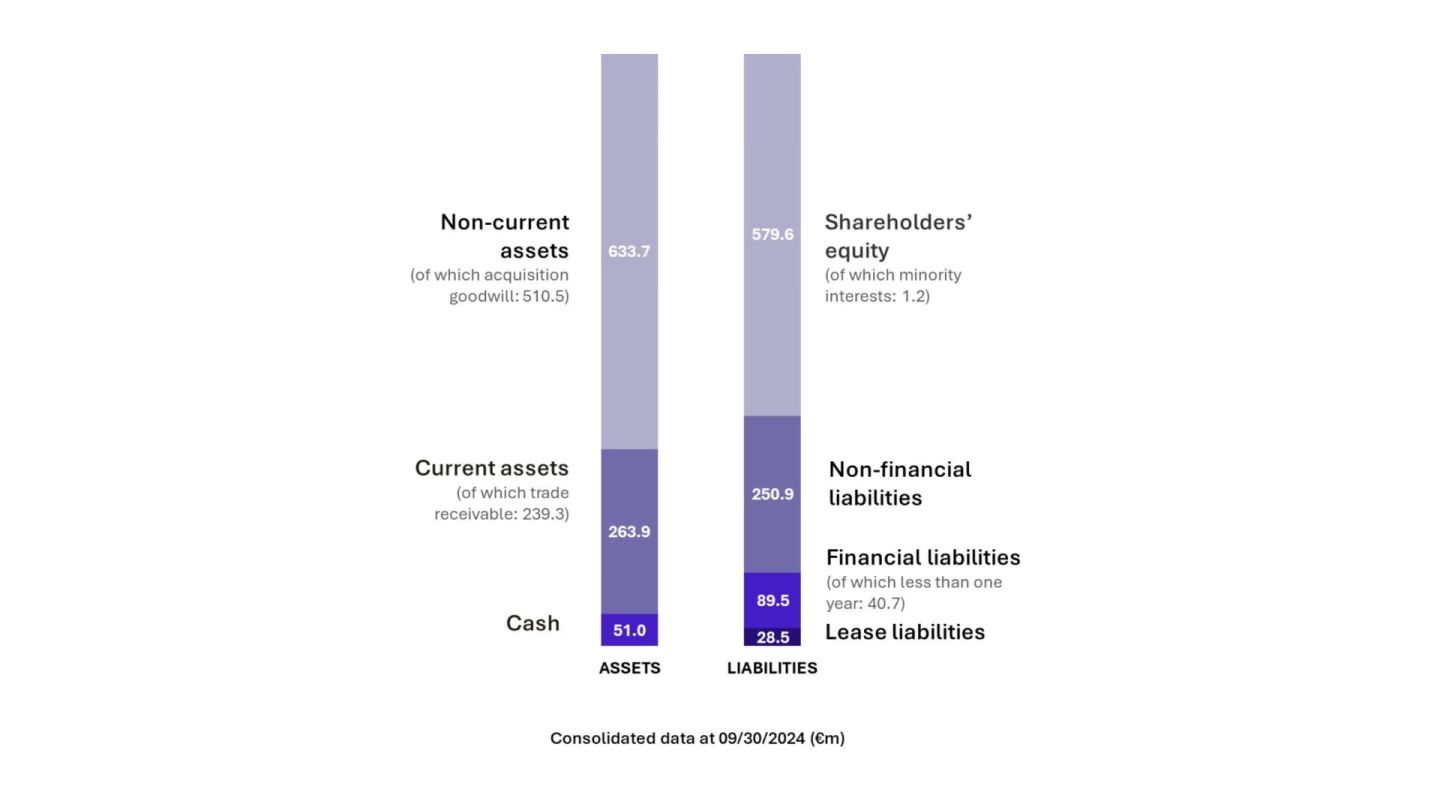
The chart shows the breakdown of WaThe chart shows Wavestone’s consolidated balance sheet on 30 September 2024, divided into two columns. The first column represents assets and the second liabilities.
On the assets side, the balance sheet consists of:
- Non-current assets: 633.7 M€, including 510.5 M€ of goodwill
- Current assets: 263.9 M€, including 239.3 M€ of trade receivable
- Cash: 51.0 M€
On the liabilities side, there are:
- Shareholders ‘s equity: 579.6 M€, including 1.2 M€ of which minority interests
- Non-financial liabilities: 250.9 M€
- Financial liabilities: 89.5 M€, of which less than one year: 40.7 M€
- Lease liabilities: 28.5 M€ vestone’s share capital on 30 September 2024